
Market Watch
Equity Market Overview Sept 2025
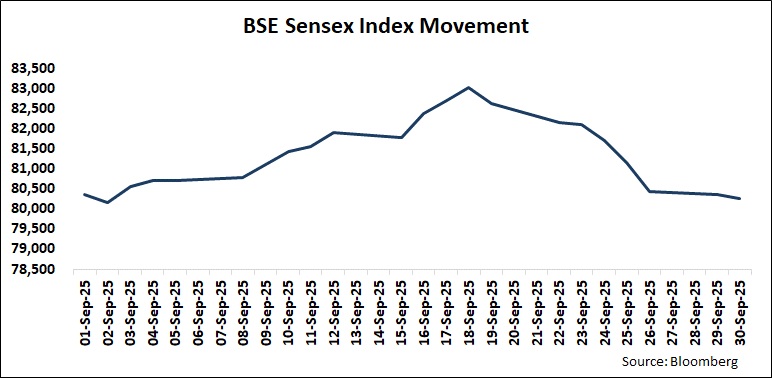
Domestic Equity Market Update
- Indian equities ended the month on a positive note. Large cap-oriented BSE Sensex ended higher by 0.6% (MoM) and Nifty 50 ended higher by 0.8% (MoM). While the BSE Midcap index ended higher by 0.61%(MoM) and BSE Small cap index ended higher by 1.45% (MoM).
- In terms of BSE sectoral indices, the sectors ended on a mixed note. Metal, Auto and Oil & Gas were the outperformers during the month.
- During the month, FPIs were net sellers in equities to the tune of Rs 149 bn. (Data as on 29th September).
- Domestic equity markets ended the month on a positive note driven by optimism around GST rate cuts, easing trade frictions with the US and sentiment turned positive after the US Fed delivered its first rate cut of the year, citing recent sluggishness in the labor market.
Global Market Updates - US equity markets ended the month on a positive note on optimism about lower interest rates, which contributed to strength on Wall Street following the Federal Reserve’s decision to cut rates by a quarter point on Sep 17, 2025, and its signal of two additional rate cuts later this year. Further gains were supported by strong momentum in the technology sector.
- European equity markets ended the month on a mixed note as investors digested the latest batch of regional economic data and continued buying in equity market on expectations of further monetary easing by the US Fed. However, gains were capped by weak US jobs data, concerns over the US administration’s trade policy and uncertainty surrounding the Fed’s interest rate trajectory.
- Brent oil prices corrected from USD 68.12 per barrel to USD 66.03 during the month after data showed an increase in US fuel inventories and oversupply concerns intensified ahead of the OPEC+ alliance’s meeting held in August, 2025. Furthermore, prices declined despite ongoing tensions in the Middle East and the escalating Russia-Ukraine conflict.
Most of the Domestic Macro data points showed a strong picture - S&P Global Ratings retained India's GDP forecast at 6.5% YoY for FY26 on the back of strong demand, increasing investment, and tax reforms. They revised India’s inflation forecast down to 3.2% YoY for FY26 which provides room for further monetary policy adjustments. Also, they expect one more 25 bp rate cut by the RBI in FY26.
- According to Moody’s, the decline in India’s effective Goods and Services Tax (GST) rates is expected to boost private consumption, but the resulting loss of tax revenue could limit progress in fiscal consolidation and debt reduction. They said that the revenue forgone is likely to exceed government estimates.
- As per data from S&P Global, India’s manufacturing sector saw a strong growth, with the HSBC India Manufacturing Purchasing Managers’ Index (PMI) rising to 59.3 in August 2025.
- According to S&P Global, the HSBC India Services Purchasing Managers’ Index (PMI) climbed to 62.9 in August 2025, up from 60.5 in July 2025.
- The Chief Economic Advisor (CEA), V Anantha Nageswaran, expressed confidence that India-US tariff discussions would conclude within the next couple of months, with a resolution to both the reciprocal tariff as well as penalty for India’s purchase of Russian oil. He said the reciprocal tariff could come down to the earlier-anticipated range of 10-15%.
- The 56th Goods and Services Tax (GST) Council meeting, chaired by Finance Minister Nirmala Sitharaman, has announced that GST rates will be reduced to 5% and 18%. Most of the items useful for common man have been moved to 5% slab.
- As per data from the Ministry of Commerce and Industry, India's eight key infrastructure sectors' growth jumped to a 13-month high of 6.3% YoY in August 2025 on account of expansion in coal, steel, and cement production. The sectors' output growth was 3.7% YoY in July 2025 and (-)1.5% YoY in August 2024.
- As per data from the Labour Ministry, retirement fund body EPFO added 2.10 mn net members during July 2025, registering an increase of 5.55% YoY. They enrolled around 979,000 new subscribers in July 2025.
- As per RBI data, India’s outward Foreign Direct Investment (FDI) moderated to USD 2.1 bn in August 2025 from USD 3.4 bn in August 2024. Sequentially, it declined sharply against USD 4.1 bn in July 2025.
- According to a report by private think tank QuantEco Research, the Eighth Central Pay Commission (CPC) payouts are likely to tilt the growth-inflation balance somewhat ‘unfavourably’ and kick off RBI's rate hike cycle in late FY27 or FY28. The report says that the final implementation by the commission may see a lag of at least 1 year, implying that revised payouts will be disbursed with sizeable arrears.
- According to a Reuters poll of property experts, home prices in India are expected to increase more sharply than earlier forecasts, driven by strong demand from wealthy buyers. The poll found that average home prices, which have more than doubled over the past decade, are projected to rise 6.3% YoY in 2025 and 7% YoY in 2026.
- According to rating agency CRISIL, banks' credit growth will accelerate in H2 FY26 and inch up to 12% YoY in FY26. Retail credit will drive growth in loan books for banks, and corporate loans growth will be slower in FY26.
- As per ratings agency ICRA, cement companies’ operating profits for FY26 are estimated to grow by 12-18% YoY to Rs 900–950 per metric tonne (MT) on the back of healthy demand, improved realisation and range-bound input costs.
- According to a report by Anarock, housing sales across the top seven Indian cities fell 9% YoY in the Q3 CY25 to 97,080 units, amid affordability pressures, rising costs, and uneven demand. In Q2 CY25, sales had dropped 20% YoY. Despite the lower volumes, sales value rose 14% YoY to Rs 1.52 trillion in Q3 CY25.
Outlook & Investment Strategy - Going forward, the Indian equity market is likely to be driven by any moves around India-US trade deal, movement in the US Dollar index, improvement in consumption demand post the proposed GST slab rationalisation, FPI/DII flows, and moves to support liquidity by RBI. The Trump administration has imposed about 50% tariff on India, including penalty due to India’s trade relations with Russia which has led to volatility in sector exposed to US. Along with that, it recently also levied an annual fee of USD 100k on fresh H1B visas and announcement of up to 100% tariffs on branded and patented pharmaceutical imports effective from 1st October 2025 from all nations. There is still expectation of better trade deal that can come about in due course. The proposed GST rate rationalisation may support sectors that could be adversely impacted due to tariffs and act as a tailwind to the overall domestic consumption going ahead. With the US fed recently cutting policy rates and hinting for more can further weight down on the dollar index, which, in turn, could direct flows towards Emerging Markets.
- With a low base, pickup in consumption demand due to GST rationalisation, or further meaningful support provided by the RBI could help drive superior earning performance which is likely to also ensure better equity market performance.
With rich valuations, incoming US tariff related weakness and continued weakness in urban demand, the Indian equity markets seem to be in consolidation mode post the recent up-move. The supply from FPIs and the Primary markets on the back of rich valuations seem to be weighing down on the market performance. The Government on its part has rationalised GST rates to improve domestic consumption. Market participants also expect further policy rate cuts by the RBI to keep growth buoyant. If further support comes about, or if tariffs get re-negotiated, or we get favourable tariffs with EU (negotiations ongoing) the markets are likely to take that positively. Currently, the markets are getting narrower and opportunities seem to be available in the set of stocks which have been able to deliver incrementally better revenue/earnings growth. Also, with no specific sector showing broad-based and continued momentum, Fund Managers who are able to be fairly nimble and identify growth ideas could generate alpha vs their peers.
In terms of deployment strategy, we are cautiously optimistic to maintain our investment deployment strategy of 50% Lumpsum and 50% staggered over the next 5-6 months, as Indian macros still remain amongst the best in the world and any near-term volatility could be used by investors to add to their exposures. Fund managers who can pick out companies with superior growth prospects are likely to outperform vs pure value pickers in the medium-term.
On allocations in Equity Mutual Fund perspective, investors could look at investing across Largecaps, Flexicap, Large and Midcap, Hybrid equity, Business cycle funds and using STP as an instrument to invest in Smallcap/Midcap/Multicap funds; in line with their risk profile and product suitability from a 2-3 years’ time horizon.
Debt Market Overview Sept 2025

Domestic banking system liquidity turned to deficit during the month on tax outflows, but ended up in surplus. Banking system liquidity as measured by the Reserve Bank of India’s (RBI) net Liquidity Adjustment Facility (LAF) stood at a daily average surplus of ~Rs 1.47 trillion in September 2025 as against a daily average surplus of ~Rs 2.78 trillion in the previous month. The call money market traded in the range of ~4.95-5.40% during the month.
Domestic G-sec yields closed marginally higher in September 2025, and the 10-year benchmark, 6.33% G-Sec 2035 bond, ended at 6.58% compared to the previous month’s close of 6.57%. Indian G-sec yields rose as the higher retail inflation print for August 2025, fuelled by higher food prices and a fading base effect, dampened expectations of another rate cut by the RBI. Further, despite the 25 bp rate cut by the US Federal Reserve in its September policy meeting, hawkish commentary from the Fed Chair weighed down on market sentiments. However, the rise in yields was capped as the government projected a lower than initially expected net revenue loss from the recent Goods and Services Tax (GST) revision, easing fiscal concerns. The reduction in longer-dated debt supply in RBI’s H2 FY26 borrowing calendar also provided support.
According to revised data from the US Commerce Department, the US Real Gross Domestic Product (GDP) spiked by an annualized 3.8% QoQ in Q2 CY25 compared to the previously reported annualized figure of 3.3% QoQ. According to the US Labor Department, the US Consumer Price Index growth accelerated to 2.9% YoY in August 2025 from 2.7% YoY in July 2025, in line with economist estimates. Core consumer price growth in August 2025 was unchanged from the previous month at 3.1% YoY, also in line with estimates. The US Fed decided to lower the target range for the Federal Funds Rate by 25 bps to 4.00-4.25%, citing a shift in the balance of risks. As per flash data from Eurostat, Eurozone inflation rose marginally as the Harmonized Index of Consumer Prices rose 2.1% YoY in August 2025, slightly faster than the 2.0% YoY increase in July 2025. Core inflation held steady at 2.3% YoY. The European Central Bank left its key interest rate unchanged, as expected. The Governing Council held the deposit rate steady at 2.00%. The refinancing rate was left unchanged at 2.15% and the marginal lending rate at 2.40%. The People's Bank of China left its benchmark interest rates unchanged for the fourth straight month despite key indicators suggesting economic slowdown. The PBoC kept its one-year loan prime rate unchanged at 3.0%. Similarly, the five-year LPR, the benchmark for mortgage rates, was retained at 3.50%.
The 56th GST Council meeting announced that GST rate slabs will be reduced to two, i.e, 5% and 18%. Most of the items useful for common man were moved to the 5% slab. The two-rate GST structure kicked-in from September 22, 2025. As per MoSPI data, India’s retail inflation inched up as the Consumer Price Index (CPI) rose by 2.07% YoY in August 2025 from 1.55% YoY in July 2025. Core CPI inflation (ex-Food and Fuel) decelerated marginally to 4.11% YoY in August 2025 as against 4.12% YoY in July 2025. India’s factory gate inflation based on the Wholesale Price Index (WPI) rose to a four-month high of 0.52% YoY in August 2025, on the back of an increase in the prices of food and manufacturing products. India's exports increased 6.7% YoY to USD 35.1 bn while imports declined 10% YoY at USD 61.59 bn in August 2025. The overall trade deficit decreased by 25.7% YoY to USD 26.59 bn in August 2025 against USD 35.64 bn in August 2024. As per CBDT data, India’s net direct tax collection till September 17 of FY26 grew by 9.18% YoY to Rs 10.82 trillion due to fewer refunds. Non-corporate tax grew by 13.67% YoY to Rs 5.83 trillion. Net corporate tax grew by 4.93% YoY to Rs 4.72 trillion. Securities Transactions Tax increased 0.57% YoY to Rs 263.06 bn. The RBI released its H2 FY26 Borrowing Calendar where the allocation of ultra-long 30- to 50-year bonds was trimmed by 5.5% compared to H1 FY26, increasing the share of bonds with 3- and 5-year maturities. Gross market borrowing of Rs 6.77 trillion is scheduled to be completed until March 6, 2026.
The liquidity condition, as measured by RBI’s net LAF, declined substantially, but remained in surplus. The RBI regularly conducted both Variable Rate Reverse Repo (VRRR) and Variable Rate Repo (VRR) auctions throughout the month to manage the banking system liquidity. In its October 2025 MPC meeting, the RBI is expected to keep policy rates unchanged and continue with its neutral stance. In the previous policy meeting, the RBI had revised its inflation outlook for FY26 downward to 3.1% from 3.7% projected earlier on the back of benign inflation outlook, while keeping growth projection same as earlier at 6.5%. Going forward, growth-inflation dynamics will continue to determine the necessity of further policy actions by the RBI. The lower tax structure announced as part of GST rationalization is expected to weigh down on inflation further, providing RBI enough space to look at policy easing. In the interim, the projection of a lower-than-expected revenue loss from GST rationalization and RBI’s announcement of a lower supply of longer dated securities in its H2 FY26 borrowing calendar has been viewed positively by market participants. In the US, the Federal Reserve cut interest rates by 25 bps and indicated that it will steadily lower borrowing costs for the rest of 2025, as policymakers responded to concerns about weakness in the job market. Going forward, further policy decisions by the Fed is expected to remain a key driving factor for market sentiments and bond yields.
The G-Sec term spreads at the longer end are expected to compress with the RBI announcing a lower long bond supply in H2 FY26, benefitting Dynamic bond funds and Gilt funds which have tactically positioned their portfolio to take advantage of the same. The spread at the shorter end of the Corporate Bond yield curve continues to remain at lucrative levels against G-secs. Liquidity is expected to remain comfortable, and the curve may steepen further. Thus, a case continues to exist for investment into corporate bond funds that are at the 1-4-year segment of the curve. Hence, investors can look at Corporate Bond Funds for a horizon of 15 months and above. For a horizon of 24 months and above, investors may consider Income Plus Arbitrage FoF or consider Dynamic Bond Funds and Gilt Funds for tactical opportunity. For a horizon of 3 months and above, investors can consider Arbitrage Funds and Money Market Funds. Whereas for a horizon of up to 3 months, investors can consider Overnight Funds and Liquid Funds. Investors can also look at Multi-asset Allocation Funds for a horizon of 36 months and above. Investors should invest in line with their risk profile and product suitability.
Disclaimer: This document has been prepared on the basis of publicly available information, internally developed data and other sources believed to be reliable. HDFC Bank Limited ("HDFC Bank") does not warrant its completeness and accuracy. This information is not intended as an offer or solicitation for the purchase or sale of any financial instrument / units of Mutual Fund. Recipients of this information should rely on their own investigations and take their own professional advice. Neither HDFC Bank nor any of its employees shall be liable for any direct, indirect, special, incidental, consequential, punitive or exemplary damages, including lost profits arising in any way from the information contained in this material. HDFC Bank and its affiliates, officers, directors, key managerial persons and employees, including persons involved in the preparation or issuance of this material may, from time to time, have investments / positions in Mutual Funds / schemes referred in the document. HDFC Bank may at any time solicit or provide commercial banking, credit or other services to the Mutual Funds / AMCs referred to herein.
Accordingly, information may be available to HDFC Bank, which is not reflected in this material, and HDFC Bank may have acted upon or used the information prior to, or immediately following its publication. HDFC Bank neither guarantees nor makes any representations or warranties, express or implied, with respect to the fairness, correctness, accuracy, adequacy, reasonableness, viability for any particular purpose or completeness of the information and views. Further, HDFC Bank disclaims all liability in relation to use of data or information used in this report which is sourced from third parties.
HDFC Bank House, 1 st Floor, C.S. No. 6 \ 242, Senapati Bapat Marg, Lower Parel, Mumbai 400 013. Phone: (91)-22- 66527100, ext 7111, Fax: (91)-22-24900983 \ 24900858
HDFC Bank is a AMFI-registered Mutual Fund Distributor & a Corporate agent for Insurance products
Mutual fund investments are subject to market risks, read all scheme related documents carefully.